




Why is API so low when it's a post-apocalypse movie outside?
COMMENT | Imagine waking up to a hazy morning. You may have experienced it recently. Perhaps even this morning.
You look outside the window and say to yourself, “Oh gosh, such terrible haze! I can barely see what’s across the road!”
Curious, you log onto the Department of Environment’s (DOE) website to see how bad the haze in your area is, and you are greeted with a fresh green balloon on the map pointing near where you live.
“Moderate!? This is a cover-up!” you might exclaim.
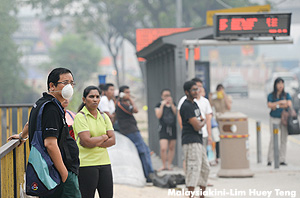 Or perhaps you have experienced the reverse – You wake up one morning after days of hiding away from the haze, and you’re absolutely delighted to see the sun again.
You are just excited and about to head outdoors again, but just to be sure, you log onto the DOE’s website and… “What? It’s still unhealthy?”
Sounds familiar?
At this point, you have probably lost all faith in the Air Pollutant Index (API) that the DOE reports. But for better or worse, there is no government cover-up.
Instead, this murky state of affairs points to a weakness in how the DOE reports the API.
The key thing to understand is this: Although the DOE provides an hourly update of the API, the figure is actually a based on an average of the past 24 hours of measurements.
What is API?
But firstly, what is the API?
Although the API is best known as a measure of the severity of the haze, it actually measures far more than that. To keep things simpler, however, we will limit discussion to the haze particles it measures.
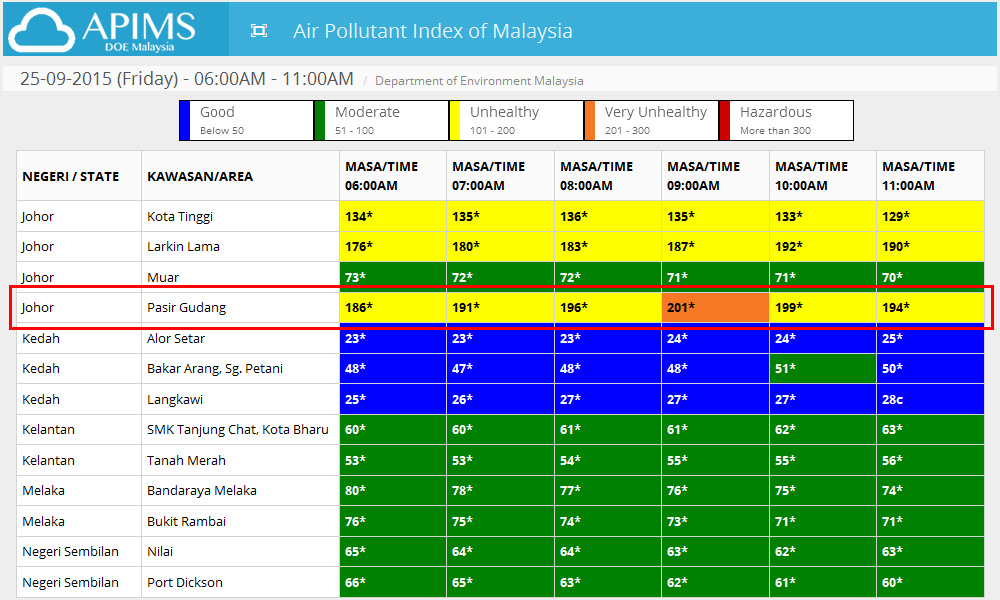 In order to determine the API during a haze, the DOE’s monitoring stations measures the concentration of coarse particles floating in the air.
These are particles that are 10 microns or less in diameter - what we refer to as PM10. The largest of these particles would be about 10 times smaller than the diameter of the average strand of human hair.
You may have heard of fine particles, or PM2.5, as well, especially when comparisons are made between Malaysia’s API and Singapore’s Pollutant Standards Index (PSI).
However, since the API does not currently account for PM2.5 pollution, it falls beyond the scope of this article.
In Malaysia, monitoring stations’ measurements of PM10 are averaged over a 24-hour period, and this 24-hour average figure is then converted to the API. This is done based health impacts of being exposed to PM10 of such concentrations.
For example, a PM10 concentration of 50 micrograms per cubic metre of air corresponds to an API of 50, which is classified by the DOE as ‘Good’.
The good, the bad and the so-so
This also corresponds to the World Health Organisation (WHO) air quality guidelines for the average PM10 concentration, which is 50 micrograms per cubic metre (averaged over 24 hours).
On the other hand, if the PM10 concentration is 350 micrograms per cubic metre, then the API would be 200, which is considered ‘Unhealthy’.
A detailed explanation of the calculations from the DOE can be found here , but the main takeaway point is that, for haze, the API is based on a 24-hour average measurement.
Hence, that 7am reading you might have seen when you just got out of bed, for example, does not only reflect the air quality of that time. It reflects everything since 7am the day before – the good, the bad, and the so-so.
So what is wrong with that? In most cases, nothing, because air quality tends to change more gradually.
In fact, without some kind of averaging to smooth out the readings, it would simply fluctuate too much to serve any useful purpose to members of the public.
 However, on hazy days, and especially for this year’s haze season, the rapidly shifting winds mean that the haze can come and go over a matter of hours.
This is where the problem starts. Many hours would have passed before the sudden change in air quality is reflected in the 24-hour average readings, and this delay is reflected in the API readings.
For example, if a monitoring station recorded 21 hours of good air quality, the final three hours of very unhealthy air would barely register on that 24-hour average - our lungs’ protestations notwithstanding.
A better measure
Fortunately, a solution to this conundum already exists, and the US Environmental Protection Agency (EPA) calls it ‘ NowCast’ .
In its latest form implemented since 2013, the EPA uses a weighted average to determine its ‘current conditions’ Air Quality Index (AQI) instead of a simple average.
This has the benefit of giving more emphasis to the most recent measurements when calculating the average air pollutant concentration, while still retaining the ability to smooth out fluctuations in the readings.
“In August 2013, the AirNow program updated the NowCast so it is more responsive to rapidly changing air quality conditions, such as those that can occur during fires.
“This change will give people information they can use to protect their health when air quality is poor - and help them get outdoors and get exercise when air quality is good,” the EPA’s website on air quality reads.
Previously, the DOE and several ministers have insisted that Malaysia’s air quality measurements are up to international standards.
In a sense, they were partially correct – The way air quality is measured and reported in Malaysia is based heavily on the EPA’s methods. It has even been argued (with good reason) that it is slightly stricter.
However, what is also true is that the EPA has since moved on to more sophisticated methods and more comprehensive air quality measurements, and it is high time that we catch up.
KOH JUN LIN is a member of the Malaysiakini team. He keeps a small personal cache of respirators well in advance of the annual haze season - just in case.


Report this comment
Are you sure you want to delete this comment?
This action cannot be undone.